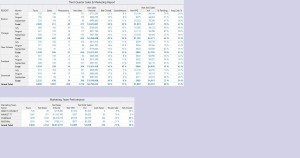
Your suite of Business Intelligence Dashboard reports can take a number of different formats.
You may have a Static Dashboard page of tables. If you choose our interactive report service, you would have the ability to sort and filter the data. (Click image to enlarge.)
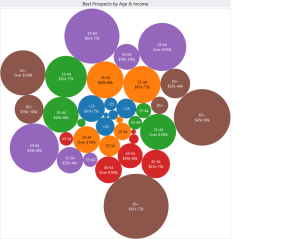
You may choose from a number of different visual graphics, such as this Bubble Chart sample of Best Prospects to show size of markets. (Click image to enlarge.)
We can also create for you a variety of reports that come together to help you tell your story.
Tab through the PDFs below to see some samples. With our interactive dashboards, you would have the ability to click on areas of the charts for greater detail.
Story Example #1 – Location of Sales Dashboard Story 1
Story Example #2 – Top Performers Dashboard Story 2
To see more examples, please open our Business Analytics Outline.
Contact us to talk about a customized Dashboard for your organization.

